Speed Monitoring in Telematics Guru
Table of Contents
Speed monitoring allows fleet managers to specify speed limits and monitor compliance with those limits. This is different to "On-Device Speeding" function, and that can be viewed here.
The asset should be assigned to the TG-Pro billing plan.
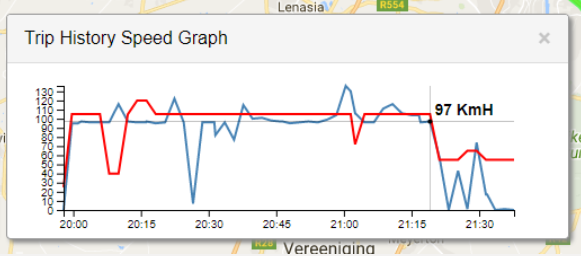
Here is one example of how this can be visualised in TG.
Speed limits in Telematics Guru:
Speed limits can come from multiple sources in TG.
Asset Speed Limit
A specified "TG Asset Limit" on the asset: assets can be assigned a speed limit. For example a certain type of vehicle should never be doing over 100km/h. This is done under Assets->Manage Assets. Click on an asset to edit it. Go to the Log Events tab. Tick the Log Over-Speed box and specify a limit for the asset

Geofence Speed Limit
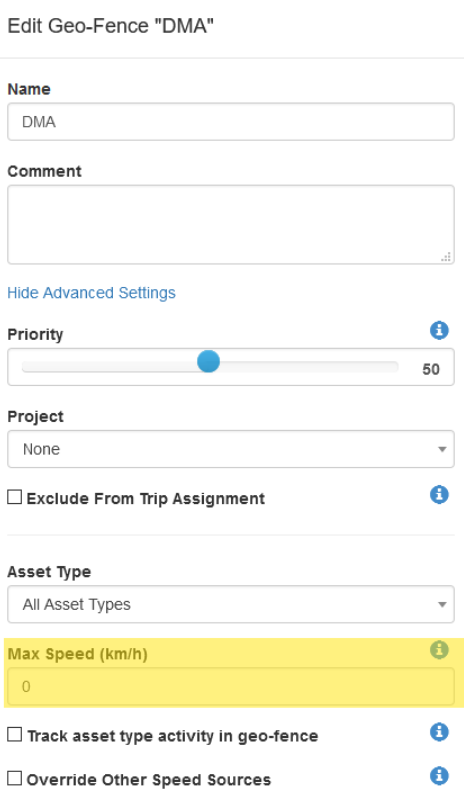
A Geofence can be given a speed limit - i.e. on a particular worksite the speed limit might be 40km/h. The max speed can be set against a geofence here:
Local Speed - Speed By Road (Requires TG-PRO)
A local limit specified by the road the asset is on: The TG-Pro billing plan allows the local speed limit to be looked up for each data point (lat/long). The location is looked up in the TomTom speed-by-road API at the end of a trip. To enable this feature:
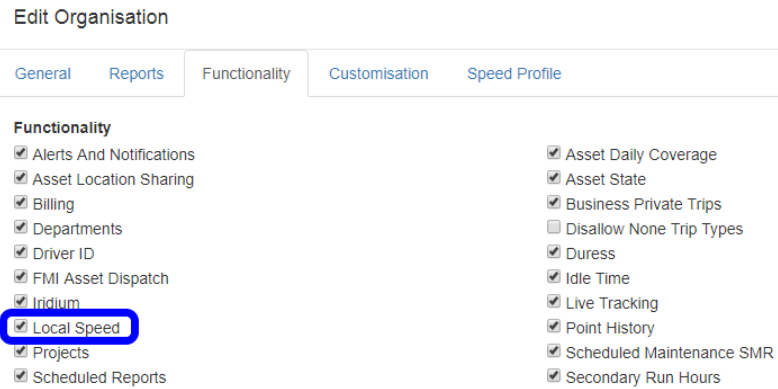
- The organisation should have the "Local Speed" feature enabled: go to Admin->Organisations. Click Edit on the organisation. Go to the Functionality tab. Tick "Local Speed".
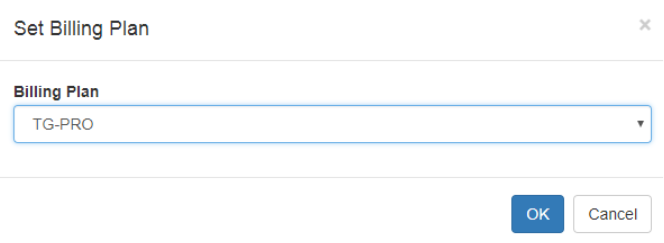
- The asset should be assigned to the TG-Pro billing plan: go to Admin-> Organisation Manage> Asset Billing Plans. Assign the asset to the TG-Pro billing plan. Be aware of the additional cost of the TG-Pro billing plan. The user should have the Organisation Manage and Billing Plan Manage permissions to be able to do this. See more about billing plans here - Asset Billing Plans
Note
The first trip after setting the device to TG-PRO, will not do speed lookups. This is to ensure we do not do historic lookups when we do not have a starting point.
The speed limit that is ultimately used to determine the violation for reporting and banding purposes is the lowest limit from these 3 categories.
For example, consider a truck traveling at 105km/h. The following limits may have been defined:
- TG Asset Limit: 80km. This implies that the truck should never exceed 80km/h, regardless of whether the local speed limit is higher
- Local Speed Limit: 100km/h. The truck's location is looked up against the TomTom API, and a limit for the road of 100km/h hour is returned.
- TG Geo-Fence Limit: A Geo-Fence may have been created with a limit of 85km/h. All assets in the organisation should not exceed 85km/h in this Geo-Fence
This truck is exceeding all 3 limits, but the lowest limit is used to determine the violation. In this case, the TG Asset Limit of 80km/h is chosen because it is the lowest of the 3. So the report will show the asset was travelling 35km/h over this limit.
Speed Profiles
- A Speed Profile defines 3 bands for the severity of the speed violation. Band 1 is the least severe violation and band 3 is the most severe violation.
- These bands allow violations to be grouped by severity.
- Speed Profiles are setup in Organisation settings: Go to Admin->Organisations. Click Edit on the Organisation. Go to the Speed Profile tab. Add a speed profile and specify the limits for each band. Band 1 is meant to be least severe and Band 3 most severe. 3 fields describe each band:
- Minimum: asset speed must exceed (local looked up speed limit + this minimum speed) to be in the band. Eg. Min = 5km/h; Local speed limit = 60km/h; then this band starts at 65km/h
- Percentage: asset speed must exceed (local looked up speed limit + this % of looked up speed) to be in the band. Eg. Percentage = 10%; Local speed limit = 60km/h; then this band starts at 66km/h
- Maximum: asset speed must be less than (local looked up speed limit + this maximum limit) to be in the band. Eg. Max = 15km/h; Local speed limit = 60km/h; then this band ends at 75km/h
- The highest (most severe) band is chosen if the speed fits it's definition. Eg. In the example above 80km/h matches all 3 bands, so the most severe band is chosen - band 3.
- Many profiles can be created in an organisation.
- Profiles should be assigned to a device: Go to Assets->Manage Assets. Click on a device to edit it. Go to the Advanced tab. Select one of the Speed Profiles.
Speed Monitoring Methods
- Reports:
If you can't view any of these reports, check that it is enabled for your organisation. If you cannot see it in the list of available reports to enable, contact support and we can enable it for you.- The Fleet Management Summary v2 uses the speed bands. Version 1 of this report does not use the bands.
- The Speed Band Event Report allows all violations to be listed, for multiple assets or drivers. This can be filtered by band. This report makes use of all speed sources above (including local speed if using TG Pro)
If an asset goes over the speed limit, then dips below again, this constitutes an event - The Speed Band Detail Report lists all of the data points (all logs where speed is above the limit) and the speed bands they fell into. This can be filtered by band. This report makes use of all speed sources above (including local speed if using TG Pro)
- The older Speeding Report simply lists speed violation according to a specified absolute speed limit, which is set when running the report. The limit must be specified when running the report. Bands, local speed limits, and Geo-Fence limits are ignored
- Speeding - Detail lists speed violations according to the Assets "Over Speed Limit" (Manage Assets->Edit->Log Events tab). Bands, local speed limits, and Geo-Fence limits are ignored. Each violation is listed.
- The Speeding - Summary lists speed violations according to the Assets "Over Speed Limit" (Manage Assets->Edit->Log Events tab). Bands, local speed limits, and Geo-Fence limits are ignored. Violations are summarized by asset.
- Manage Trips View:
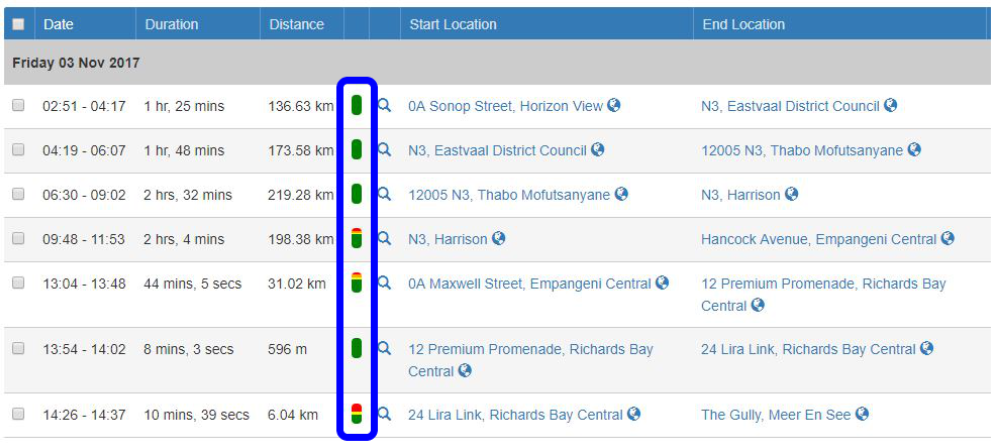
- In the Manage Trips View a colored bar is shown for each trip, allowing trips to be assessed at a glance. The colors correspond to the various bands: green is band 0; yellow band 1; orange band 2; red band 3. Hovering over the bar reveals the percentage time spent in each band.
- Trip History Map View:
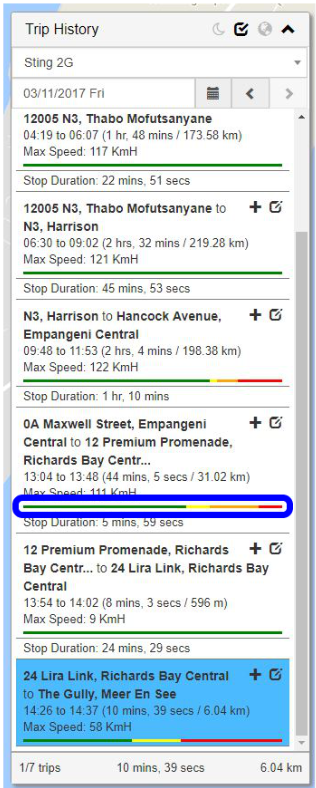
- In the Trip History Map View, a horizontal line should appear under each trip in the right hand trip list. The color of the line corresponds to time spent in the various bands. There is also the option to color the track on the map according to the band that the asset was in.
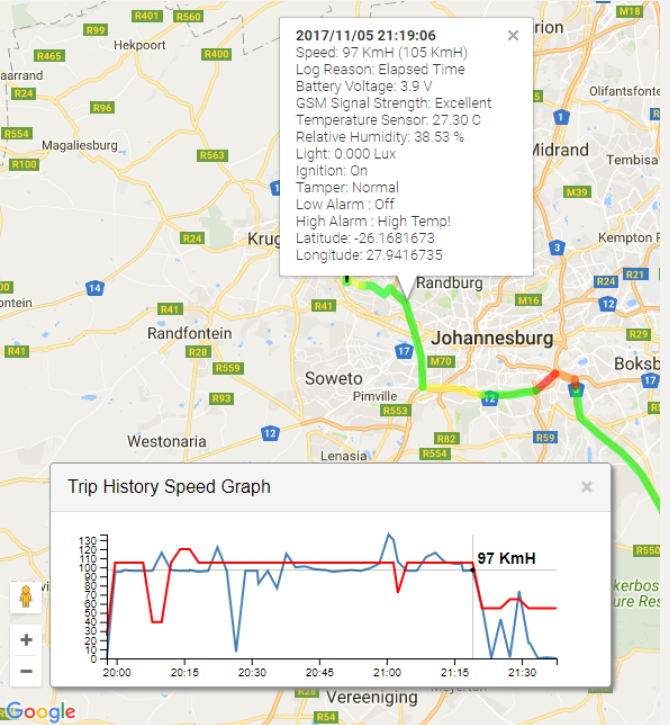
- Additionally, in the Trip History Map View, a Speed Graph can be shown. This plots the asset speed and speed limit against time for the trip.
- Alerts:
- Alerting is based on a speed defined in the alert. This speed fixed for the alert cannot be related to local speed. Geo-Fences can be specified in the alert. For example, an alert may be created with these criteria: Use Device Data Value: Speed is Above: 100km/h; Use Geo-Fence: Area1, Area2, Area3, When: Inside Geo-Fence.
- Telemetry:
- The Telemetry View allows you to inspect each point logged by the device. Check on: actual speed, local speed, used speed limit, and where it is on the map. There are more details below.
Full Example
Let's work through a full example. We want to enable local speed limit look ups on an asset
The Organisation in question should have the Local Speed function enabled. Go to Admin->Organisations. Click Edit on the organisation. Go to the Functionality tab. Tick "Local Speed.
We need to setup a Speed Profile. Go to Admin->Organisations. Click Edit on the Organisation. Go to the Speed Profile tab. Add a speed profile and specify the limits for each band. The screen shot below will set out 3 bands:
Band 1: a minimum of 5km/h over the speed limit. Eg. Local speed limit = 120km/h. Speeds above 125km/h will be in band 1. In conjunction with band 2, this is effectively 125-135km/h.
Band 2: a minimum of 15km/h over the speed limit. Eg. Local speed limit = 120km/h. Speeds above 135km/h will be in band 2. In conjunction with band 1 & 3, this is effectively 135-150km/h.
Band 3: a minimum of 30km/h over the speed limit. Eg. Local speed limit = 120km/h. Speeds above 150km/h will be in band 3. In conjunction with band 2, this is effectively all speeds above 150km/h.

Now we need to assign the asset to the TG-Pro billing plan. Go to Admin->Asset Billing Plans. Assign the asset to the TG-Pro billing plan
The device will log data, and after it's trip completes, the trip data will be checked against local speed limits. The data will be classified into bands.
Let's access the data by band. Using the Speed Detail Report we can specify which asset and band we are interested in, and it will list all of the points that were in that band:

Let's access the data for the whole organisation. The Fleet Management Summary v2 will allow this.

Let's check on the trips in the Manage Trips View. The highlighted bars show the band break down of each trip. Green is band 0, yellow band 1, orange band 2, red band 3. Hovering over the bar gives a tool tip with the percentage time in each band.
Let's look at the trip in the Trip History Map View page.
On the right, you will see the list of trips for the day. Under each trip is a bar, showing the percentage time in each band.
 |
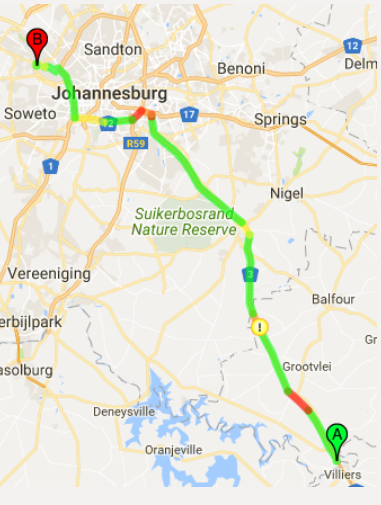 |
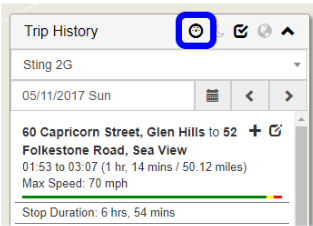
| The track on the map can be colored according to the band that the asset was in. Use this icon to turn on the band view: | The band view as it appears on the Trip history Map |
 |
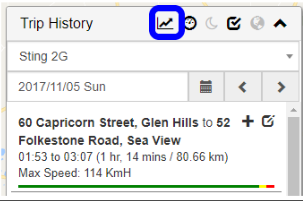 |
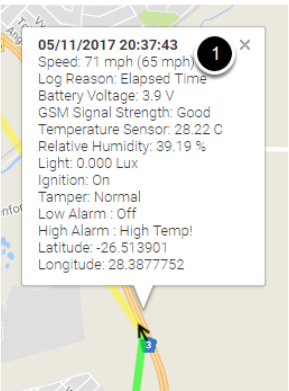
| Hovering over each point will show the speed and speed limit. The (1) shows the actual speed and the used speed limit: | To show the speed graph, click on this icon from the Trip History Map View page: |
That will give you a speed graph, like the one below. The graph plots asset speed and the speed limit again time. Hover over point logged on the map and it will highlight it on the map. The reverse also works - hover over a point on the graph will show the corresponding point on the map.
Looking at the Telemetry for the Asset:
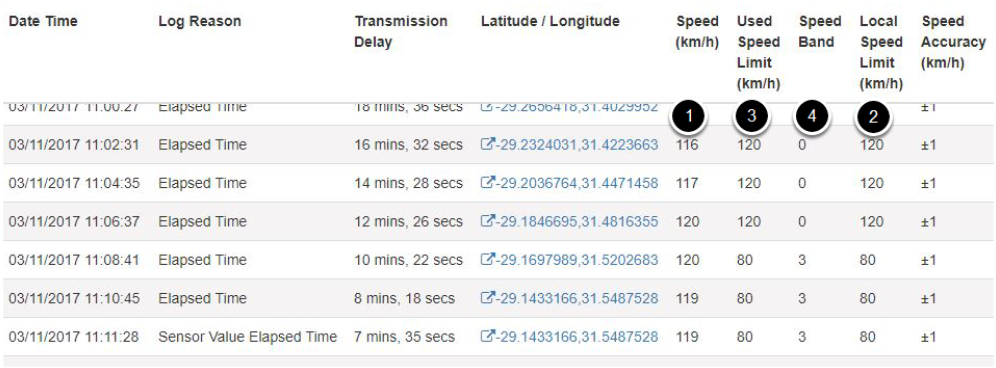
The Telemetry View conveniently shows each record that the asset logged, which includes the actual speed logged by the device (column marked 1 below). If local speed is enabled for the organisation, and if the asset is on TG-PRO billing, then local speed look-ups will be done after each trip has ended. The result of the look will be put into the telemetry table (column marked 2 below). In the beginning of the article, we discuss how the used speed limit can come from a variety of places (asset max, Geo-Fence, local speed). The speed limit that is ultimately used for the band analysis is put into the "Used Speed Limit" column (column marked 3 below). The speed profile is then used to select a band for this data point (column marked 4 below). Click on the lat/long link to see where this location is on the map.
Here is an example:
Common troubleshooting:
I don't see the speed bars on the map view or the manage trip view?
- Answer: Ensure that the Organisation is enabled for Local Speed Lookup. Then ensure that the Asset is linked to the TG-PRO billing plan. With those in place, the local speed look ups should happen.
The report I'm looking at doesn't include local speeds!
- Answer: there are some older reports that don't. Ensure that you choose the right report. Follow the links in the report section above to get to the right ones.
The local speeds aren't accurate!
- Answer: unfortunately the accuracy is based on TomTom's knowledge of local speed limits. We've found TomTom to be the best provider of speed limits in our regions. Please test the system and build your confidence that the speed limits known by TomTom are good enough to be useful for your application.
