RAG Report
Table of Contents
Telematics Guru has a RAG (Red, Amber, Green) Report.
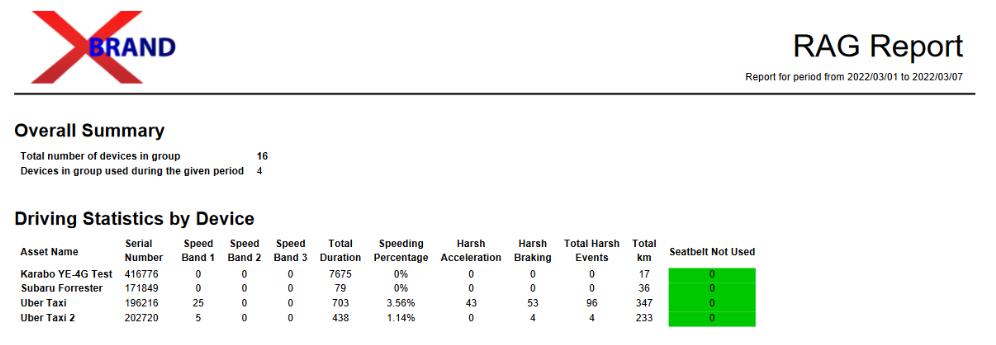
Example Output

The report shows the following information
- Speeding events (based on speed bands configured) - see Speed Monitoring in Telematics Guru
- Total Trip Duration (minutes)
- % of this trip time spent speeding
- # Harsh acceleration events
- # Harsh braking events
- # Harsh Driving events
- Total km travelled
- Count of Events (the specific event is configurable). The count is colour coded in a configurable Red, Amber, Green Scale.
The information is presented in this way inclusive of total trip time and distance to give some context to the exception events. i.e. an asset that does 10x as much driving, but only slightly more harsh events may arguably be a better overall driver.
Set-Up

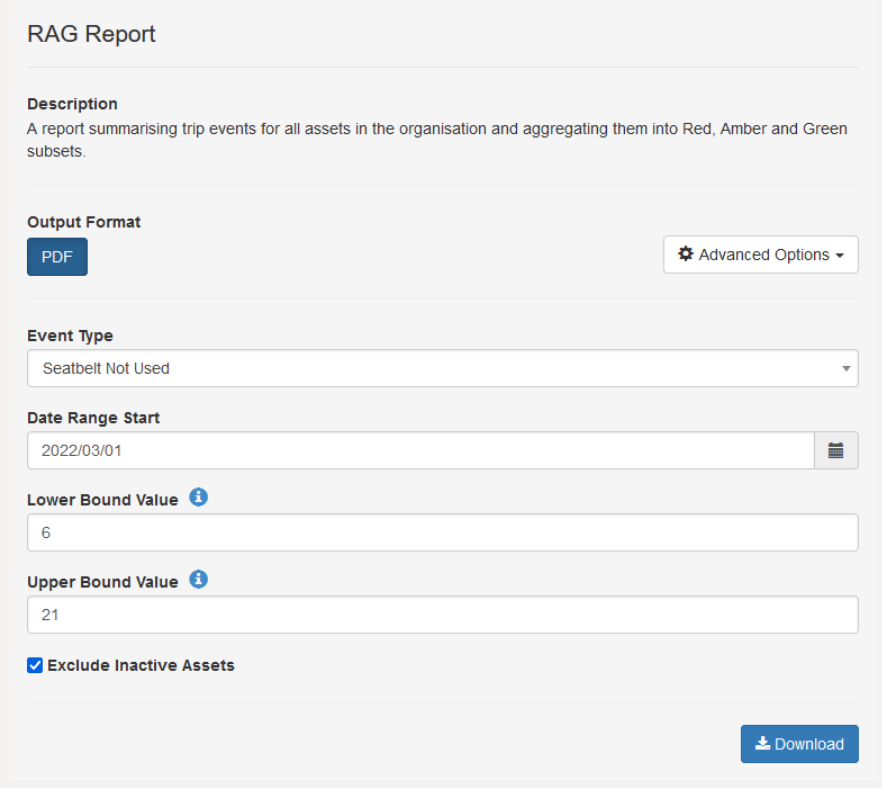
- Select the Event Type. Available event types are the ones created as per Events vs Alerts
- Select the date range start. The report runs for 7 days. So the 2022/03/01 selection above runs for this range

- Select Lower Bound and Upper bounds to select the colour coding ranges. i.e. the above results in.

- Exclude Inactive Assets can be selected so that assets which haven't made any trips for the time period aren't shown in the report.
