The Asset Utilisation Report

Written by Matthew Clark-Massera
Updated at November 24th, 2025
Table of Contents
The Asset Utilisation is designed to classify assets as 'Utilised' if they have the following conditions:
-
Time spent in trip
- Occurring inside or outside the selected geofence
- For the chosen assets
-
Within the defined time period, based on configured work hours
This definition now aligns with the enhanced reporting metrics, offering clearer insights into how and when assets are being used, both during and outside of operational hours.
This is useful for fleet management and tracking depot usage, or time spent outside a particular area.
For example, we may consider assets well utilised if they spend a significant proportion outside of a given depot during the week, and under-utilised if they remain in the depot, parked all month.
To access the report, navigate to Admin → Reports. It is found under the Fleet Reports Section
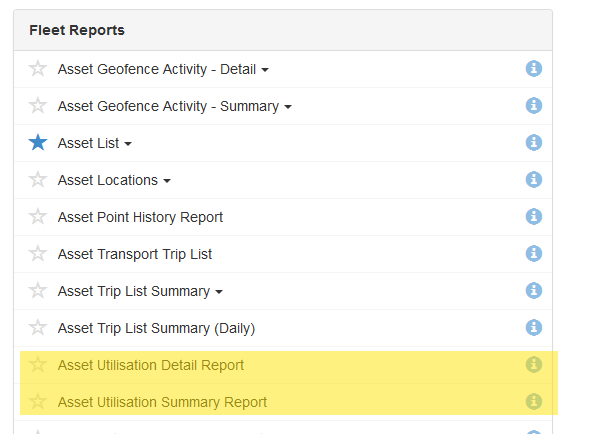
If it is not shown, you may need to add it to the Organisation's or given user's reports.
Asset Utilisation Detail Report

For the constraints of all assets, for trips outside of geofence 'DMA1' between 07:00 and 17:00 on Wednesday the 1st of October, the report generates the below data, consisting of two sections.
Fleet Trip List Summary
Found on the right side of the Excel report.

Trip Count
Number of trips for the Day
Time inside geofence during work hours
Total duration the asset spent within the selected geofence during configured work hours.
Calculation:
This is calculated by checking if the trip starting point is in the selected geofence, and if the start time is within Work Hours (start) and Work Hours (end).
If this is true, then:
- The time in geofence is incremented by the time since the previous trip ended. This is the time from the start of the work day till the trip started.
- Or from when the previous trip ended till the next trip started.
Then, the report checks if the trip ended in the selected geofence. If this is true, this trip's duration is added to the time in geofence, if no duration value exists yet for the trip, no time is added.
If the last trip for the asset ended in the selected geofence, it is inferred that the asset remained there until the end of the time period.Includes time when the asset is either stationary or travelling inside the geofence.
This helps indicate on-site presence or utilisation during active business hours.
Time inside geofence outside of work hours
Total duration the asset spent within the selected geofence outside of configured work hours.
Calculation:
- Captures any time spent within the geofence before or after the defined work hours, within the reporting period.
- This might indicate overnight parking, after-hours deliveries, or idle time.
- Useful for assessing off-hours use or security-related considerations (e.g., unauthorised movements).
Time outside geofence during work hours
Total duration the asset spent outside the selected geofence during configured work hours.
Calculation:
- Includes time the asset is either moving or stopped outside of the geofence while the workday is in progress.
- Indicates time spent in the field, offsite operations, or travelling between job locations.
- Valuable for tracking productivity or identifying over-utilisation away from the base location.
Time outside geofence outside of work hours
Total duration the asset spent outside the selected geofence outside of work hours.
Calculation:
- Captures all time spent outside the geofence when it's not within the scheduled working period.
- This may include after-hours trips, weekend movements, or unexpected travel.
- Useful for flagging potential unauthorised usage or abnormal asset behaviour.
% time in Geofence
percentage of trip time spent inside selected Geofence
% time ex Geofence
percentage of trip time spent outside selected Geofence
Distance (km)
Total distance travelled
First trip start time
Asset started moving at this time
Last trip end time
Asset stopped moving for the day at this time
Usage Profile by Asset
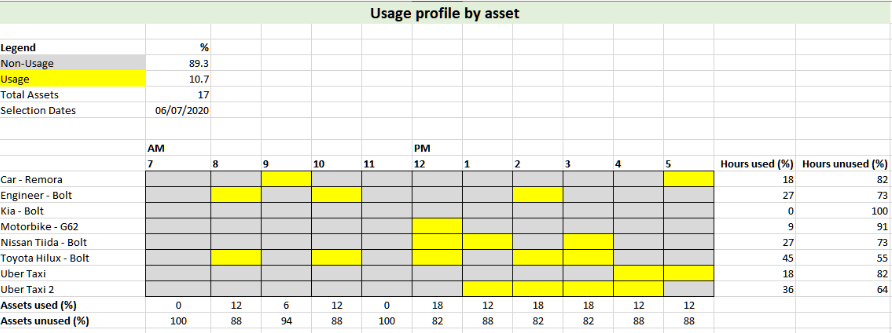
The other half of the Utilisation report consists of an hourly breakdown for the time period declared.
Here you can see when a specific asset was in trip outside the declared geofence and the breakdown of those statistics.
For example;
The asset Toyota Hilux was in trip during the hours periods
- 0800 → 0900
- 1000 → 1100
- 1200 → 1300
- 1400 → 1600
Totalling usage of 45% usage during the time period of 7am to 5pm. Overall, all assets together were in trip for just over 10% of the time period.
Weekly Utilisation Report
Similar to the daily utilisation report, the weekly variant highlights the days of individual assets were in trip outside the selected geofence and calculates the usage statistics.
