Turn on Debug Logging
Table of Contents
Devices hold debug verbosity settings. This controls how many debug records are logged. The setting can specify 4 different levels for a number of device modules (GPS, GSM, Accelerometer, etc).
The 4 levels are:
| Info: | maximum information; highest data usage; only use this level if you are debugging a problem (eg. movement threshold crossed; starting trip) |
| Warning: | informative warnings; low to moderate data usage depending on errors encountered; provides information on retries and everyday errors (eg. SMS read timeout) |
| Severe: | severe issues are logged; low data usage; provides information on errors that significantly affect the device operations (eg. commit failure) |
| Critical: | only critical issues are logged; lowest data usage; logs are only created on events critical to the systems operations (eg flash memory failure) |
Default settings
The default setting is Severe. Debug settings are specified with an expiry date. On the expiry date, the setting is reverted to severe by the server.
Applying debug settings using Device Manager
Select a device (1)

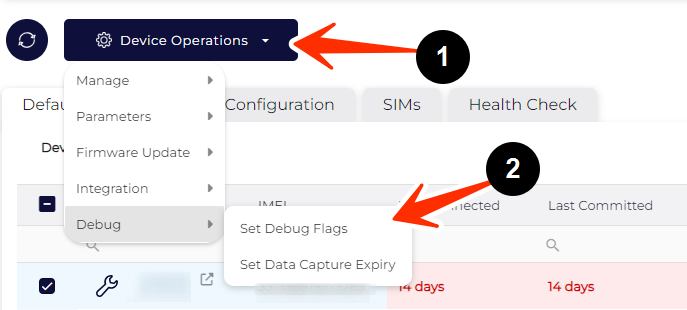
Go to Device Operations (1); Set Debug Flags (2)

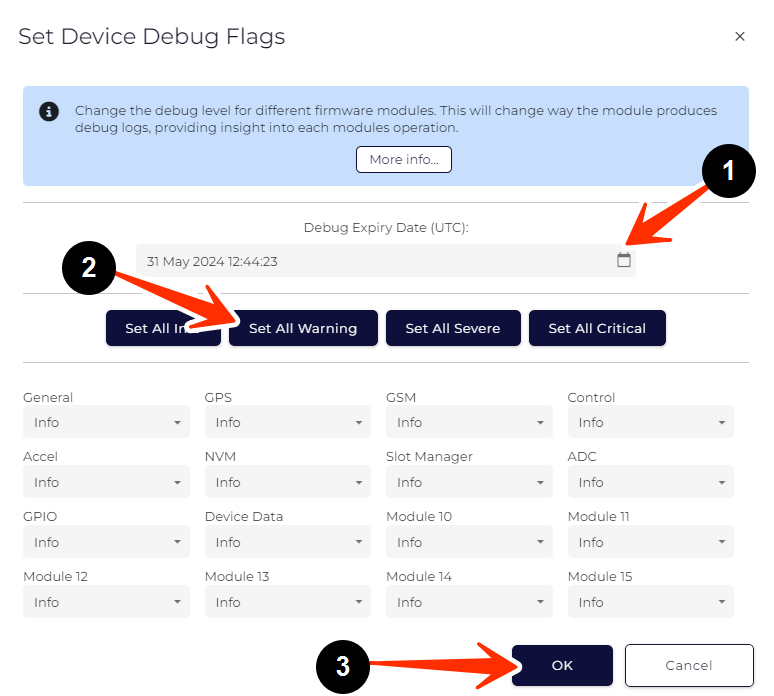
Select Debug Expiry Date (1), choose appropriate level for all modules (2), then click on OK (3). After the expiry date, the level will be reverted to Severe. Levels for individual modules can also be specified using the drop-down menus.

In the background, OEM queues an Async Message to go down to the device. It will be received the next time the device connects, or immediately if currently connected. So these settings may only apply after a new connection if the device is not currently connected.
Viewing Device Logs
Click here to see how to view captured data.
Applying debug settings using the DM Link
When in the Provisioning Tool Application:
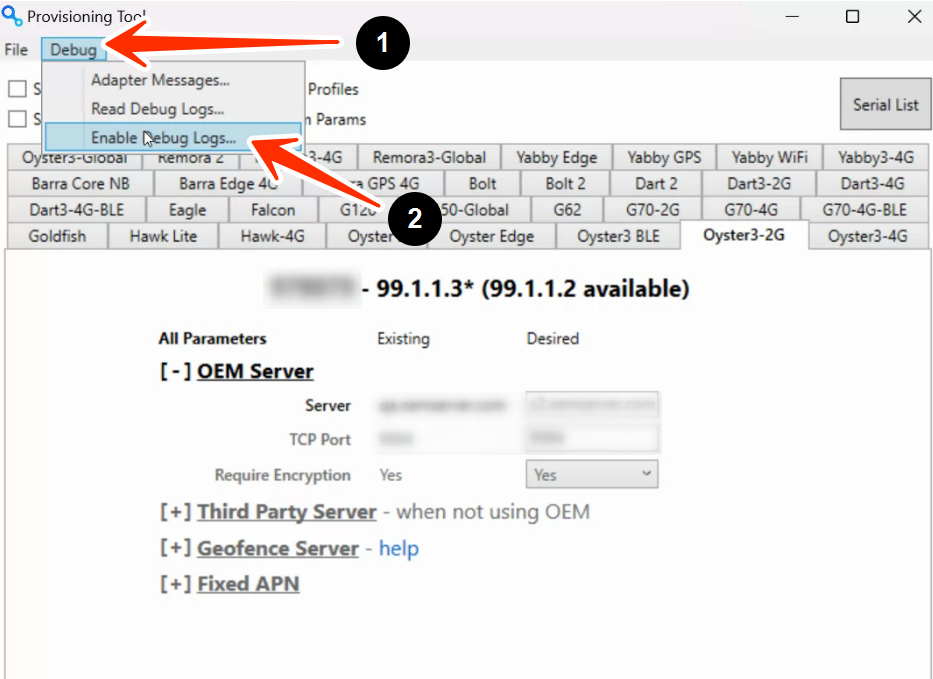
(1) Navigate to the Debug tab then (2) Enable Debug Logs…

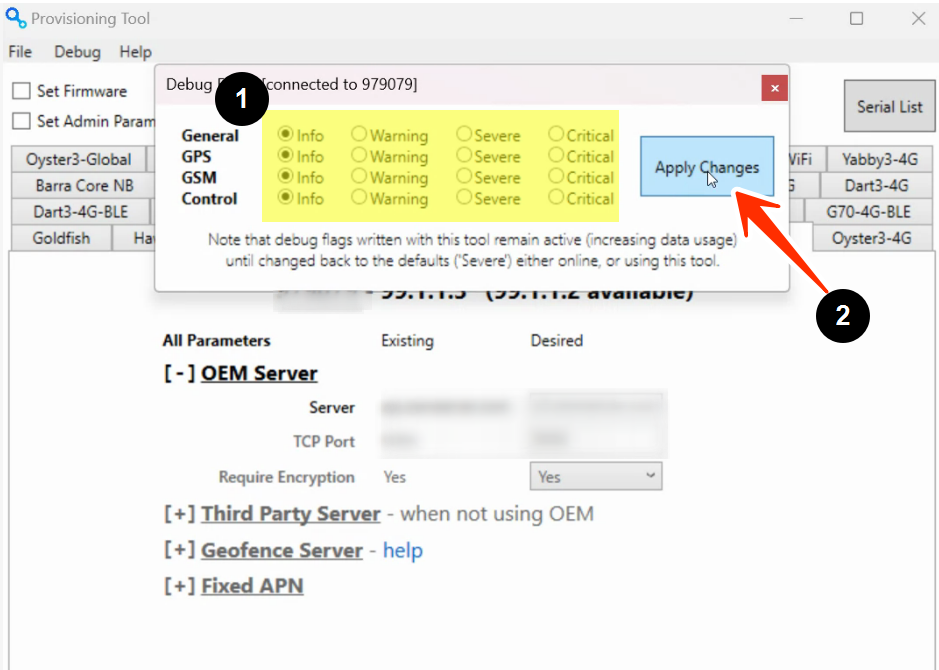
(1) set the appropriate level for the appropriate then click (2) Apply Changes

To see these logs please see Accessing Debug Logs from Device.
