Oyster Sigfox Battery Curves

Written by Matthew Clark-Massera
Updated at March 5th, 2025
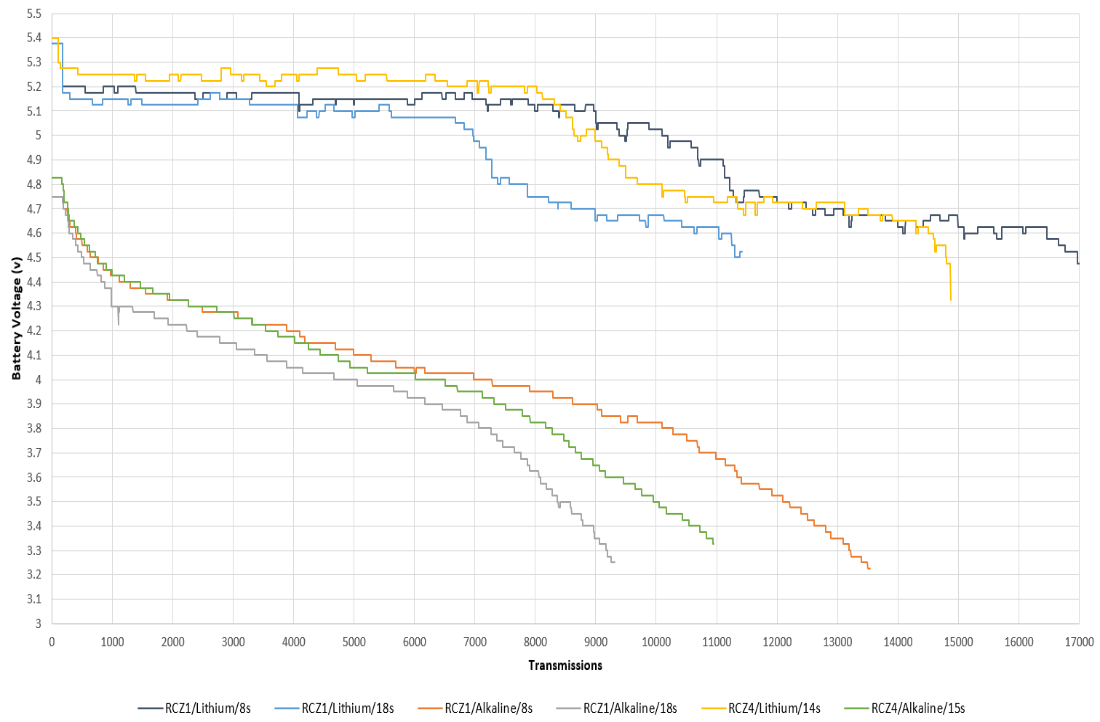
The Oyster Sigfox reports its battery voltage in each update message. Since it supports both Alkaline and Lithium battery chemistries, this value indicates a different remaining capacity depending on what type of batteries are installed. Some typical discharge curves are shown below. The traces are taken from test units in the RCZ1 (Europe / South Africa) and RCZ4 (Australia) regions, with various average GPS fix times (8s, 14s, 15s, and 18s as per the legend). These units were transmitting an average of 100 positions per day, which allowed a low average fix time.
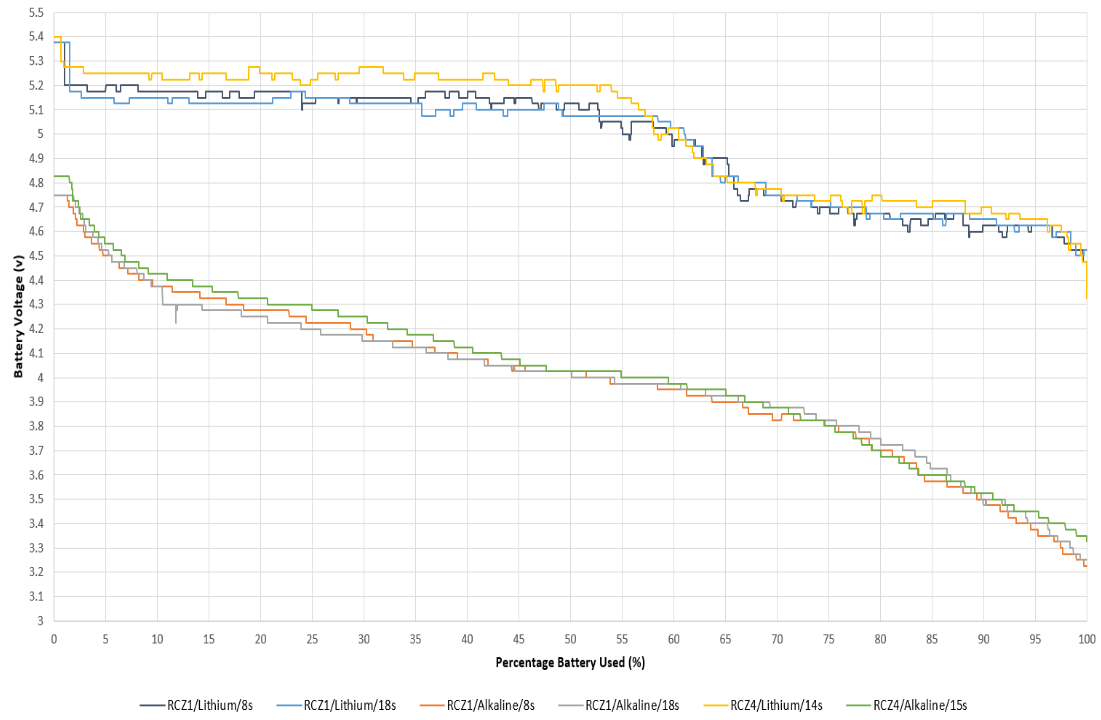
Some observations from the graphs:
- The Alkaline and Lithium traces overlap, so you can't detect the battery chemistry from the voltage alone.
- The Alkaline curve is gradual, and allows easy derivation of an approximate battery percentage.
- The Lithium curve is abrupt, and only allows a segmentation into High / Medium / Low / Critical regions.
- However, you can calculate a more detailed battery capacity estimate using the Device Statistics uplink (type 2 in the Integration Guide), together with the equations in the attached spreadsheet.
- Lithium batteries last 30% longer than Alkaline batteries at room temperature. The difference is larger at temperature extremes. They are also less prone to sudden failure.
Battery life is strongly affected by the average GPS fix time. The average GPS time can be quite a lot lower when tracking aggressively, than it is when sending once-a-day heartbeats (10-20 seconds versus 60-120 seconds). This means that most use cases will last somewhere from 6 - 24 months. Increasing the tracking rate by a factor 10 does not mean that the battery life will go down by a factor 10. For help calculating an estimated battery life, see the attached Excel spreadsheet.