Customizing the Dashboard in Device Manager
How to use the Dashboard widgets in Device Manager

Written by Jake Tannenbaum
Updated at June 14th, 2024
Table of Contents
Components of the Dashboard
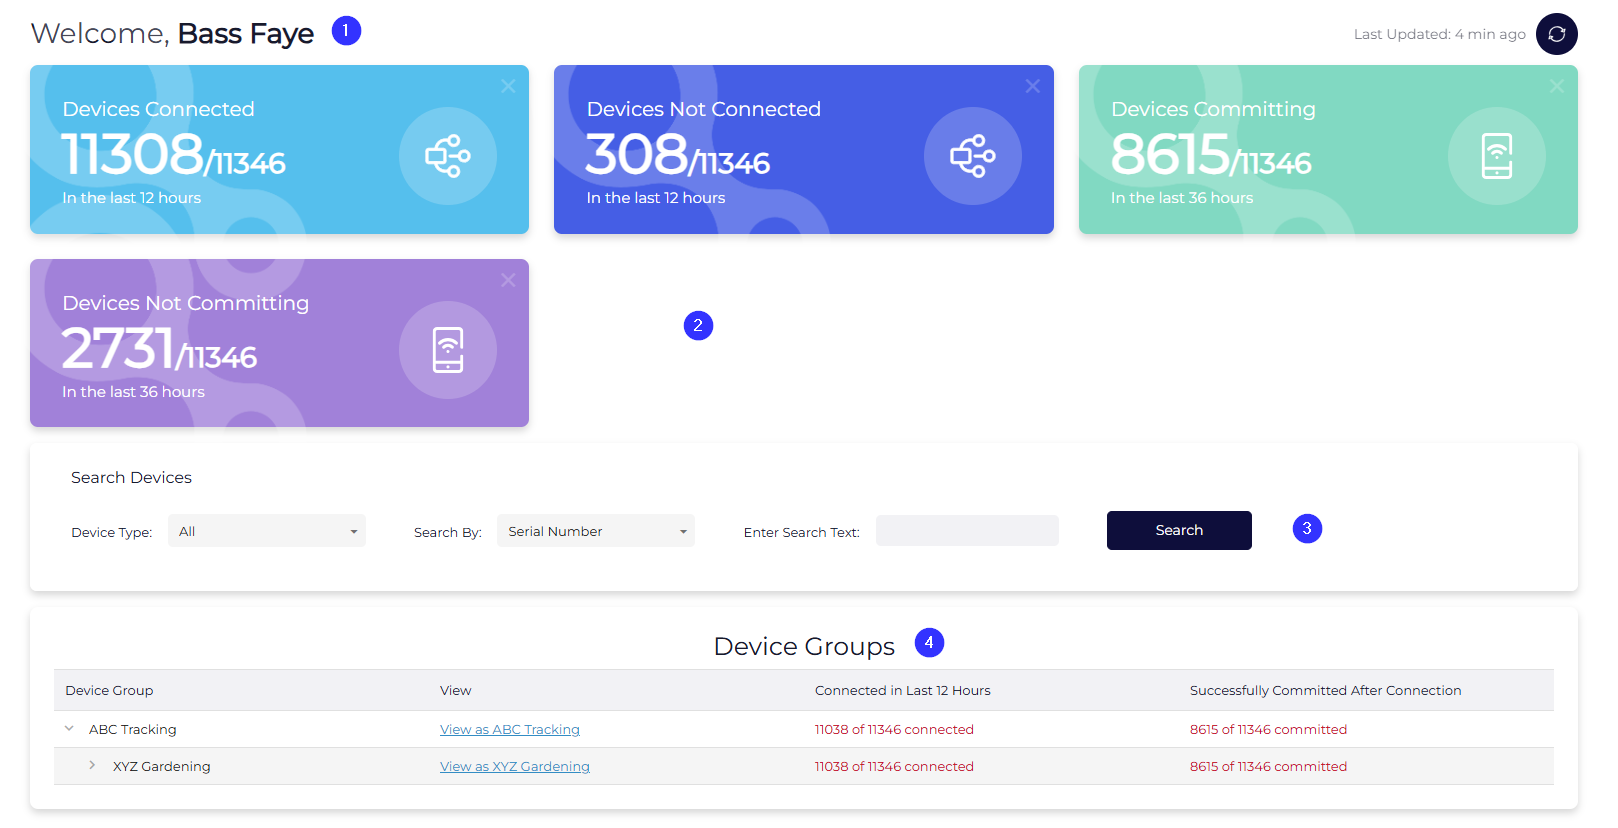
When you log into Device Manager for the first time, the Dashboard will be your landing page. Consisting of four main areas, the Dashboard can be customized to provide key metrics as to the health of your account.
-
Welcome Message - Is this you? If not, please contact your administrator immediately!
-
Widgets - These are key metrics for your account, covering connectivity and user management. You can customize which widgets show (detailed below), and refresh them manually with the circular button in the top right.
-
Search Box - Quickly find devices with a universal search.
-
Device Groups - Use your Device Groups to jump to sets of devices or get a snapshot of device health by connector.
Customizing Widgets
The purpose of widgets is to give you a quick summary of your device health metrics and your user security. The widgets available are as follows:
| Widget Name | Description |
|---|---|
| Devices Connected | This widget tallies the number of devices that have checked into the Device Manager server in the last 12 hours against the total number of devices in your account. |
| Devices Not Connected | This widget tallies the number of devices that have not checked into the Device Manager server in the last 12 hours against the total number of devices in your account. |
| Devices Committing | This widget tallies the number of devices that have passed some data to their respective connectors in the last 36 hours against the total number of devices in your account. |
| Devices Not Committing | This widget tallies the number of devices that have not passed any data to their respective connectors in the last 36 hours against the total number of devices in your account. |
| Active Users | This widget tallies the total number of users that have logged in within the last 24 hours against total number of users in your account. |
| Inactive Users | This widget tallies the number of users that have not logged in within the last 24 hours against the total number of users in your account. |
| Users with 2FA | This widget tallies the number of users that have set up their 2FA, this does not include SSO users. |
| Users without 2FA | This widget tallies the number of users that have not set up their 2FA, it includes both users that have yet to set up 2FA and users exempt from 2FA. |
Interacting with Widgets
To add a new widget, use the Edit Dashboard button in the top right corner of the application. Clicking the cog-wheel icon will reveal a list of available widgets to add to your Dashboard view.
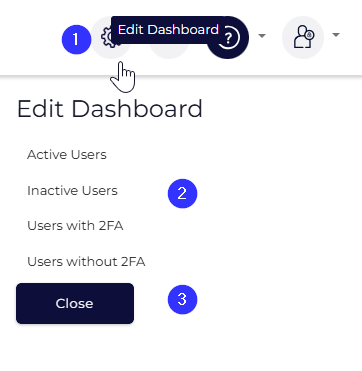
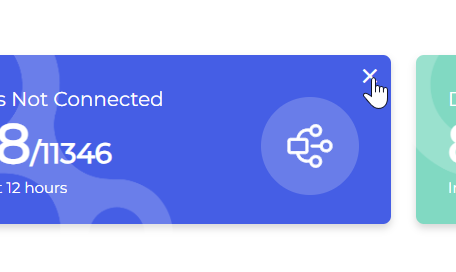
To remove a widget, simply press the X in the top right corner of the card. You will be able to restore it again with the options under the Edit Dashboard button.
Searching Devices
The device search functionality is outlined in detail in our article on Searching Device Manager.
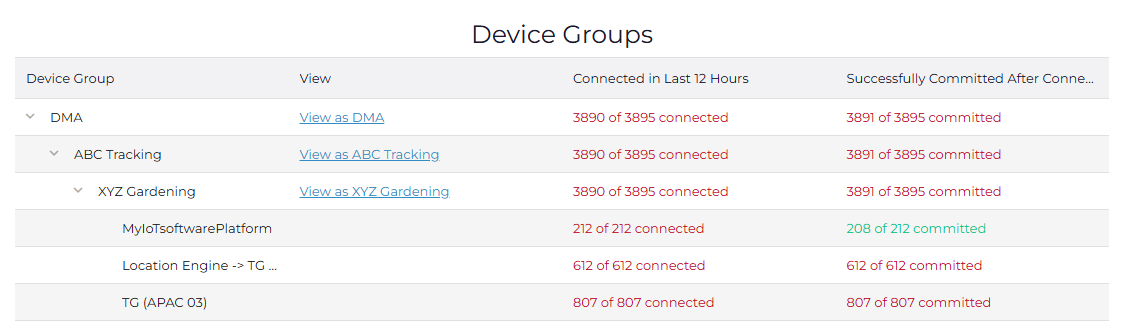
Device Groups
The purpose of this section is twofold:
- By clicking on the View As {Your Client Here} hyperlink, you can jump to the Devices section with a filter that ensures you only see devices that meet that Device Group filter. This is a really quick way to view all devices for a specific Client. By applying more and finer grained Client groups, you can increase the segmentation of your devices in this section.
- By expanding each Device Group down to the Client and then the connector level, you can view the different connectors set for the devices under each Client as well as whether or not they are successfully transmitting data. This is a key health metric.