Reviewing Telemetry Data in Device Manager (Data Capture)
Where and When to Turn on Data Capture

Written by Jake Tannenbaum
Updated at June 14th, 2024
Table of Contents
What is Data Capture?
Digital Matter IoT devices produce two types of data:
- Telemetry/Sensor Data
- Debug Information
As a device management platform, Device Manager is normally only a conduit for the telemetry/sensor data. Using Connectors, Device Manager will pipe telemetry/sensor data messages to your front-end IoT Software Platform of choice (for example: Telematics Guru). There are different integration options available, but in general, what remains in Device Manager is only the debug information, which contains server check-ins, firmware update confirmations, error logs, and diagnostic messages. This information is viewable through the Logs tab within Device View.
Because we use Connectors to distribute telemetry/sensor data out of Device Manager, it is not available for inspection within the interface during troubleshooting. Data capture is a feature that temporarily makes that data available within Device Manager so that it can be used by team members that don't have access to the end platforms, or to make a comparison between what raw data was sent by the device and what transformations occurred after it left the Connector.
Data capture is useful for a few purposes:
- Digital Matter support staff can view device data to assist in debugging without needing access to an end platform
- Checking data parsing/decoding when integrating. Data being sent from the device as captured via Device Manager can be compared to what is received on the end platform. The actual raw data will be identical but this is useful to spot any errors with payload decoding.
How to Set Up Data Capture
- Starting on the Device Grid, either:
- Select your device with the checkbox to the left of the grid and click the black Device Operations button at the top left of the Device Grid table.
- Click on the Device Operations wrench icon next to the device serial within the Device Grid itself.
- Select your device with the checkbox to the left of the grid and click the black Device Operations button at the top left of the Device Grid table.
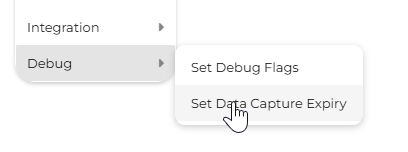
- In the menu that appears, navigate to Debug, and then Set Data Capture Expiry.
- Within the popup menu that appears, choose the date and time that you would like the data capture to turn off. This means that data capture will be active until this date/time has passed. When you have chosen your time, click OK.
Please note that times shown are in UTC and will not match your local time unless you live in the GMT Timezone (Iceland, Burkina Faso etc.).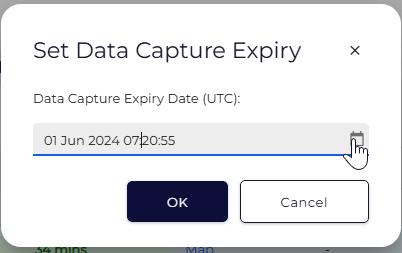
- The next time that it connects, your device will begin displaying telemetry/sensor data in the Logs tab of the Device View. It will cease doing this once it closes a connection after your expiry date has passed.
I Don't See Anything Happening in Logs
Turning on Data Capture for a device doesn't mean that the next message from your device will be visible in Device Manager.
Devices typically operate in discrete sessions, during which they will maintain an open connection with the server and transmit data. For a battery-powered device, a session will be short as a connection is opened, data is sent, and then the device enters a sleep mode until its next scheduled check-in. For a hardwired device, especially one that is in-trip, a connection can be open for hours at a time. Data Capture will only apply on the next new connection your device makes. If you cannot wait that long, or the issue is related to the connection state somehow, you can use the Restart Device button within the Device View to perform a firmware reset and initiate the data capture.
3rd Party Direct Users
Please note that device logs cannot be viewed on Device Manager if the devices are using the third party direct/option 4 integration method.
Viewing Logs
Please see this article for details on how to view data records.